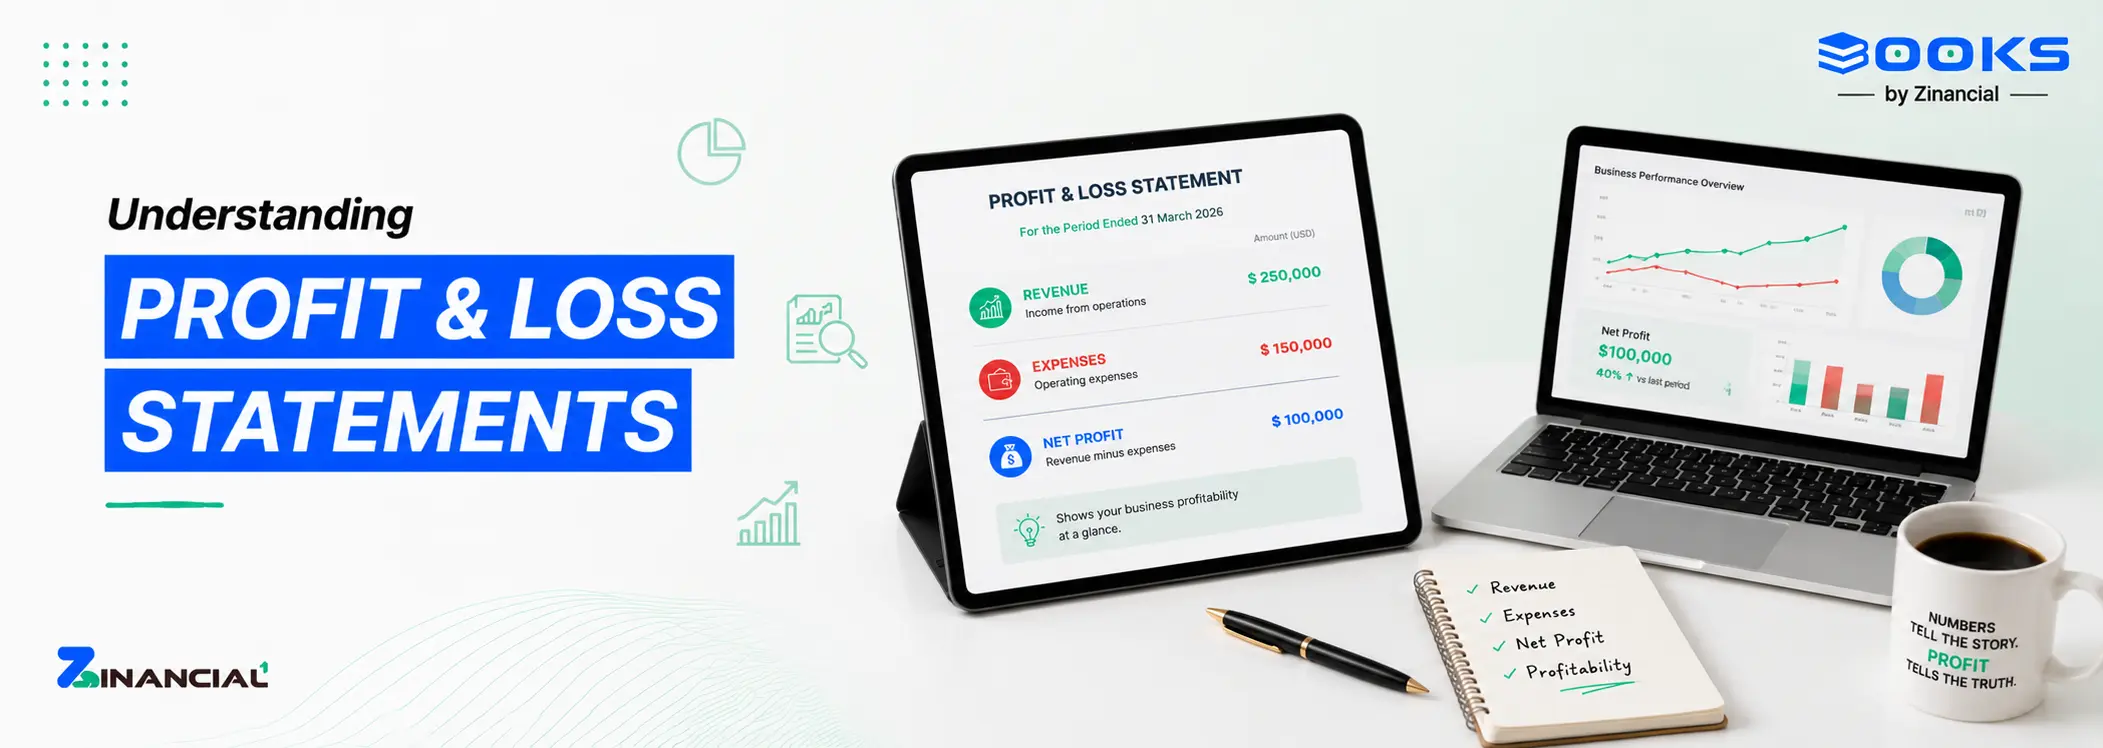
Every business owner looks at revenue. Fewer truly understand what the numbers are saying beneath it. A profit and loss statement is not just an accounting document. It is a decision tool. It shows whether your operations are sustainable, where money is leaking, and how efficiently you convert revenue into profit.
Many founders review a P&L report only during tax season. That is a mistake. Strong financial reporting habits directly influence growth decisions. According to the Global CEO Outlook by KPMG, 73 percent of CEOs say data-driven insights are critical to long-term performance. Financial clarity starts with understanding your numbers at the core level.
If you have ever searched for how to read a P&L statement or wanted profit and loss explained without jargon, this guide breaks it down clearly and practically.
A profit and loss statement summarizes revenue, expenses, and net income over a specific period. Monthly. Quarterly. Annually. It answers one simple question: did the business make money?
At its most basic, the structure looks like this:
| Section |
What It Represents |
Why It Matters |
| Revenue |
Total income generated |
Indicates demand and pricing power |
| Cost of Goods Sold |
Direct production costs |
Shows operational efficiency |
| Gross Profit |
Revenue minus COGS |
Measures core profitability |
| Operating Expenses |
Salaries, rent, marketing |
Reflects cost discipline |
| Net Profit |
Final profit after all expenses |
Shows true financial outcome |
Revenue alone means nothing without context. A growing top line with shrinking margins signals a deeper issue. That is why consistent financial reporting is non-negotiable for scaling businesses.
Platforms like Zinancial Books make this analysis easier, turning raw P&L data into clear insights you can actually use.
Make your P&L a management tool.